If used properly, Firebug can be a very useful tool in helping diagnose performance issues or simply provide an in-depth insight in to a web application or site.
Using the Firebug profiler to get Javascript statistics on a given page is very easy and takes very little time to set-up.
Below is a step-by-step guide on setting up Firebug for profiling mode.
- Firstly download and install Firebug on Firefox – I personally haven’t tested the add-on in Chrome so the profiling option may also work on there
- Click the Firebug icon so that the pane opens up at the bottom of the window
- Click the Console tab then Profile
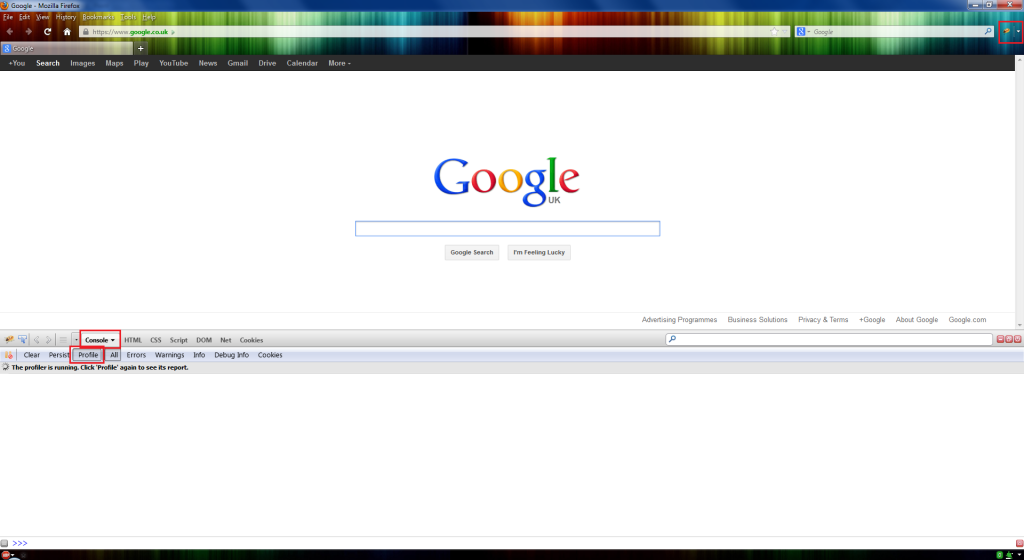
Firebug Profile Enabled
- Reload the page and click Profile again so that the profiling stops. What happens here is that the time between clicking the profile the first time to start and second time to stop is that all Javascript events and calls are recorded.
- You should now see a screen similar to the below:

Firebug profiled events

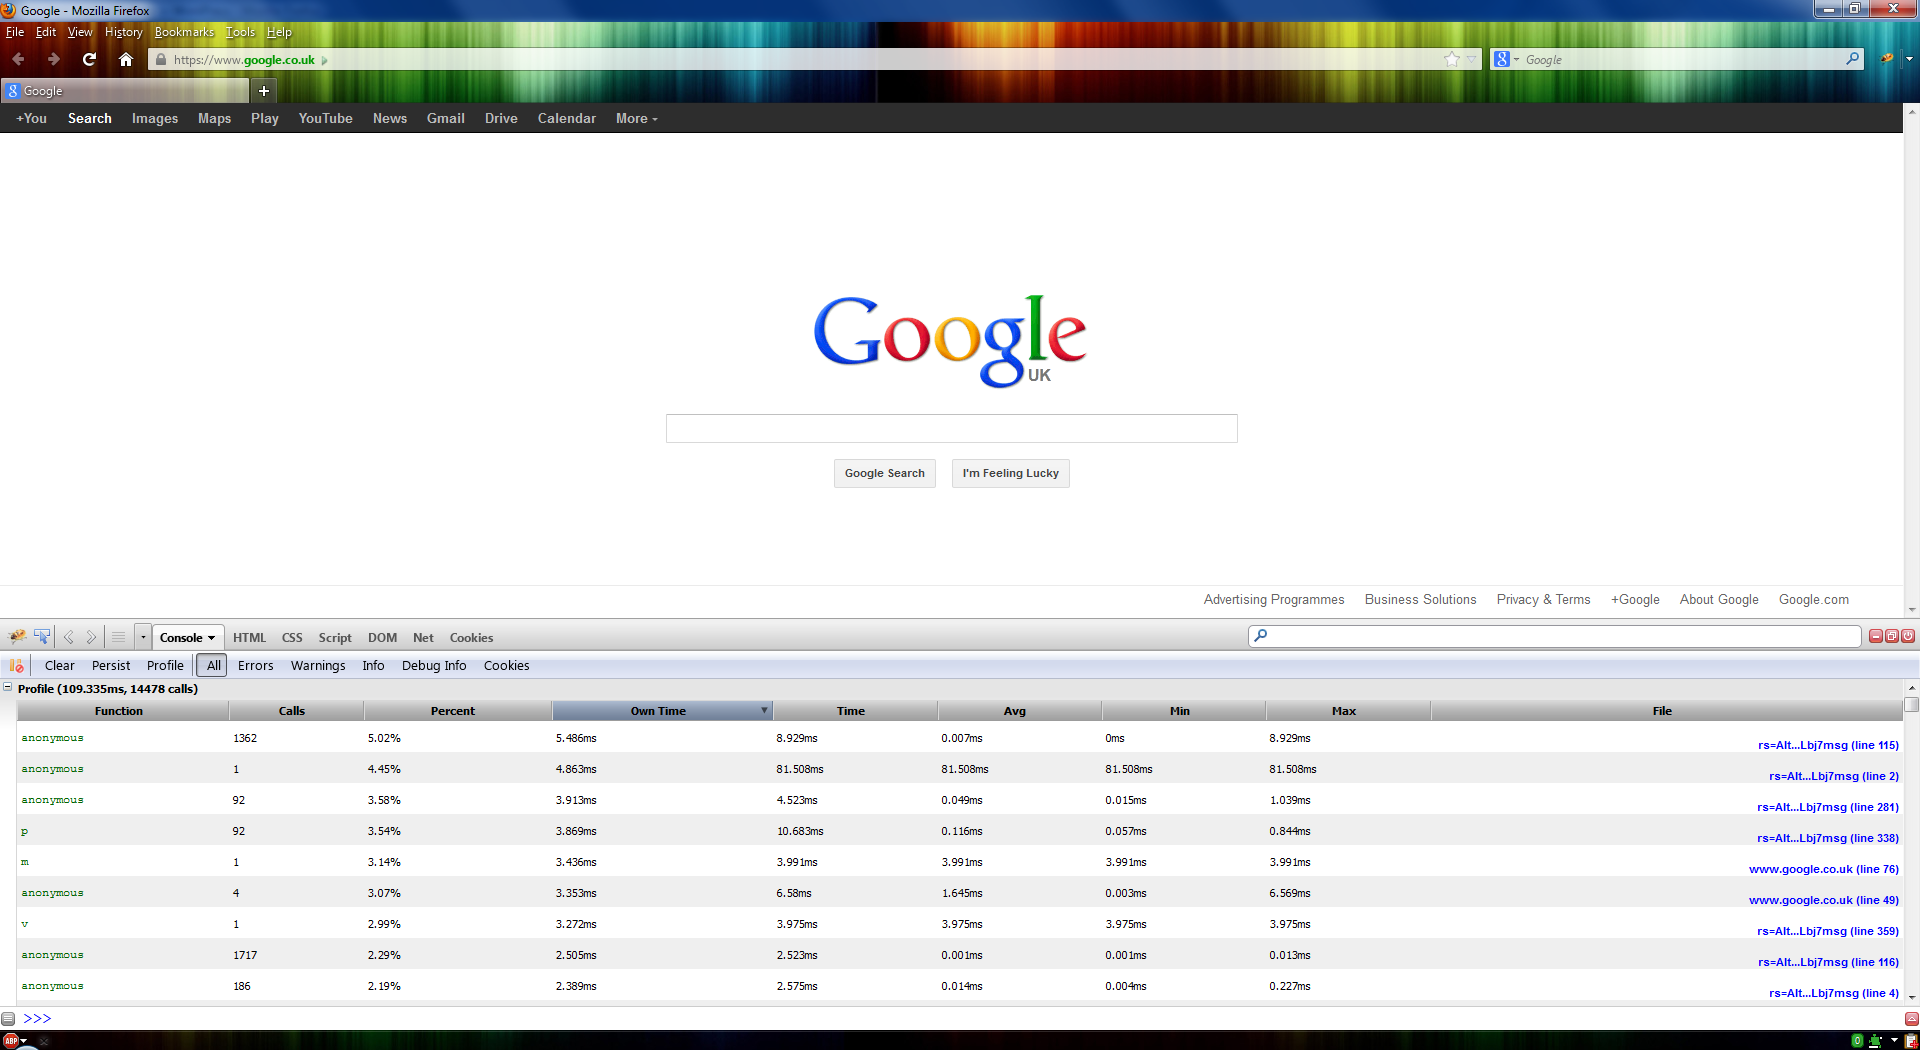
According to Firebug’s wiki page, the column names are as described:
| Column | Description |
|---|---|
| Function | Name of the called function (“(?)” or “anonymous” for anonymous functions) |
| Calls | Number of calls to the function |
| Percent | Percentage in time in comparison to all function calls within the profiling session |
| Own Time | Time spent within the function (time spent within functions called by that function are not taken into account) |
| Time | Summary of time spent within the function of all calls |
| Avg | Average time for one call of the function |
| Min | Minimal time spent within the function |
| Max | Minimal time spent within the function |
| File | Name of the file plus line number, in which the function is located |
All of the statistics are useful but some to keep an eye on are the Calls and Own Time statistics. A high number of own time ms and low number of calls can indicate some elongated JavaScript processing taking place.
A good place to start looking if you observe such behaviour is in the File field. This will tell you the potentially troublesome JavaScript file as well as the line number to the function being executed for that particular call. Right clicking the file location and clicking Inspect in script panel will take you to the line number.
I hope this small guide helps and I hope to write a similar article for memory profiling next time!