So the title is a bit misleading but I figured it’s what most people will search if they want to get active call stats from their Cisco Unified Communications infrastructure – it’s certainly what I searched when I wanted to achieve the same thing. Turns out you can only get active call stats via SNMP from the Cisco Unified Border Element (CUBE).
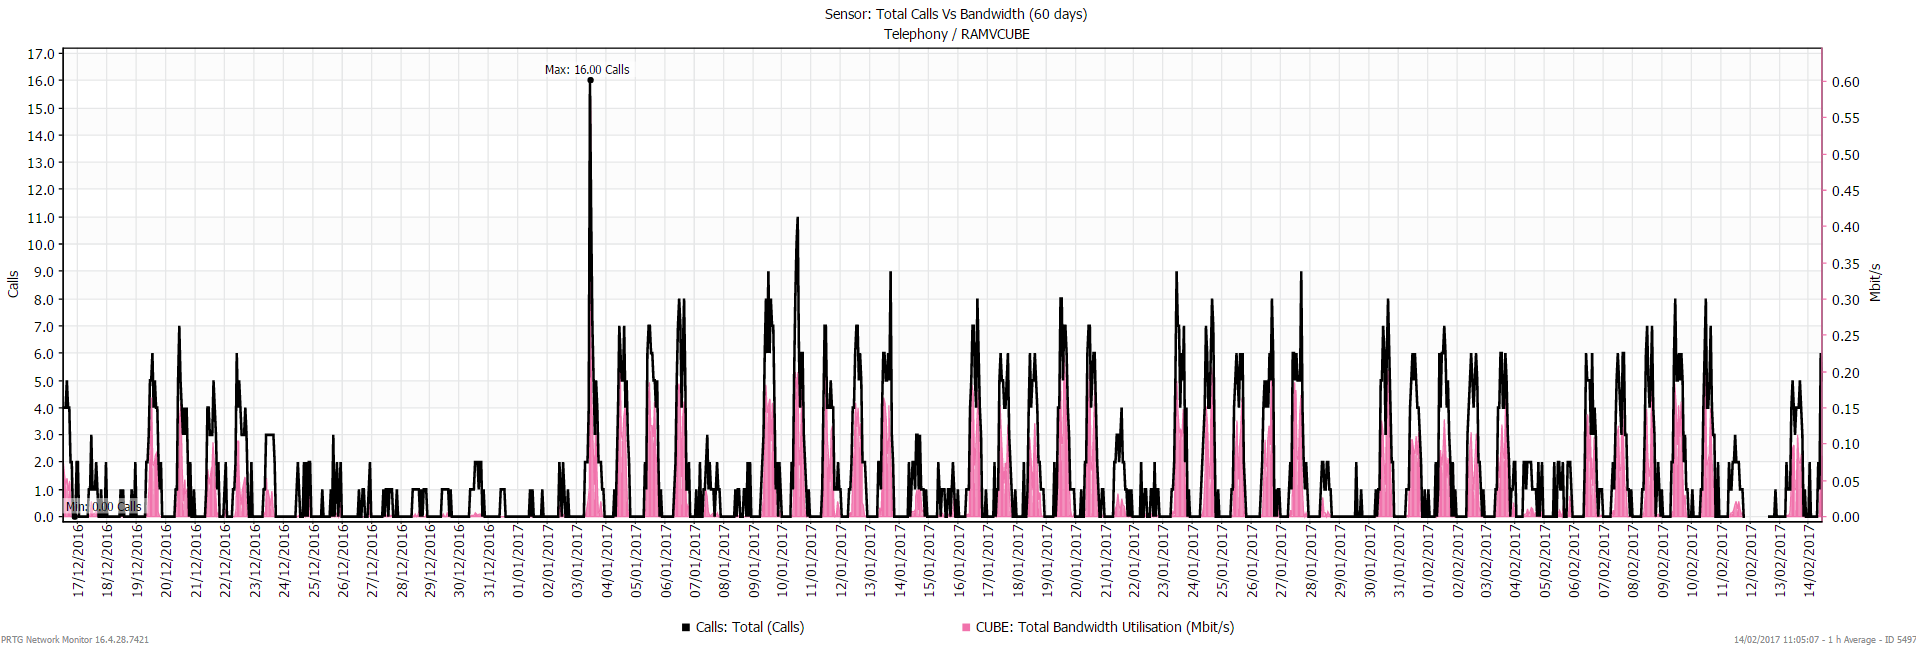
I will show you how you can get the active incoming/outgoing and total external calls and how you can use these in PRTG to get a nice graph going of Active Calls Vs Bandwidth.
What you won’t see is the number of internal calls as we are only monitoring the CUBE. Internal calls don’t touch the CUBE and as far as my research went, the CUCM server doesn’t keep track of active calls… at least not without some manipulation of OIDs.
- First we need to SSH to the CUBE and enable SNMP
configure terminal
snmp-server community <your-community-string>
snmp-server location <location of CUBE>
snmp-server contact <contact e-mail>
- Next we need the dial-peer voice numbers/tags for the inbound and outbound calls. Do a show running-config on the CUBE and look for the sections labelled dial-peer voice <number>
You need to figure out which of your dial-peers’ match up to inbound and outbound calls. In my set-up it looks like this:dial-peer voice 10 voip description Outbound Dial-peer to SIP Provider translation-profile outgoing Outbound preference 1 [...] dial-peer voice 20 voip description Inbound Dial-peer to CUCM translation-profile outgoing Inbound preference 1 [...]
So dial-peer 10 is outbound calls and dial-peer 20 for inbound calls.
To confirm you have the right dial-peer numbers, you can do a SNMP walk against the following OID 1.3.6.1.4.1.9.9.63.1.3.8.4.1.2 – you should see only a handful of sub-OID’s – start doing a few test outbound/inbound calls and you should see the values change.
- In PRTG add a SNMP Custom sensor. We’ll create two of these – one for outbound calls and another for inbound.In the OID put the following:
1.3.6.1.4.1.9.9.63.1.3.8.4.1.2.<dial-plan>
It should look something like this:
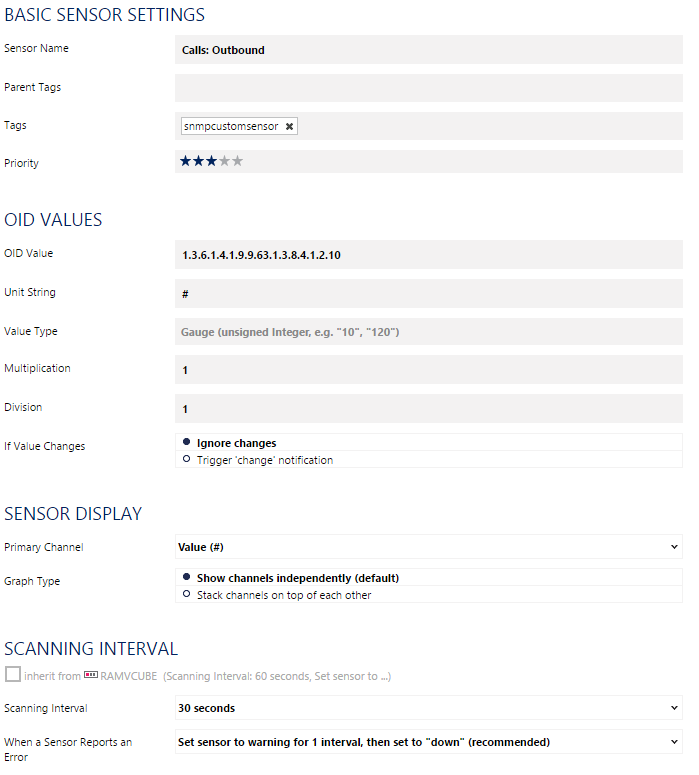
Now do the same for outbound calls.
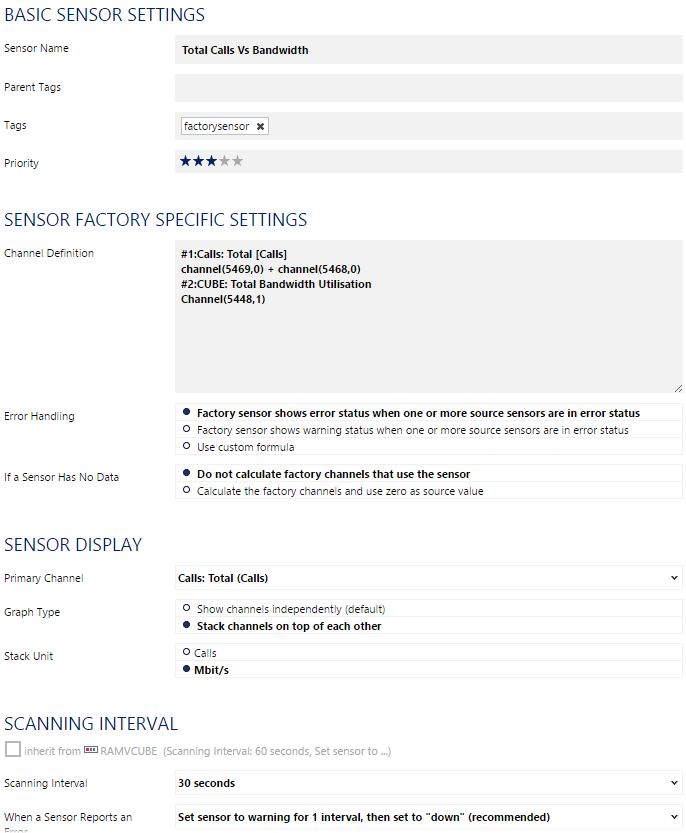
- Now add a Sensor Factory sensor in PRTG.Follow the screenshot below but note that the sensor ID’s will be different in your PRTG instance.
#1:Calls: Total [Calls] – all this does is label the axis
channel(5469,0) + channel(5468,0) – these are the sensor ID’s for inbound and outbound calls. You can find the sensor ID’s in the URL of the sensor.
#2:CUBE: Total Bandwidth Utilisation – the other axis for bandwidth
Channel(5448,1) – This grabs the bandwidth sensor from the CUBE and uses channel 1 which equates to traffic out.So basically: Channel<sensorID>,<channelID>
That’s all there is to it. I’ve only demonstrated how to do Total Calls Vs Bandwidth but you could easily to Inbound Vs Outbound, etc by playing around with the Sensor Factory in PRTG.